2018年12月8日雅思写作机经预测1
导读:上一次的雅思考试已经结束,下一次的考试还会远吗?为了帮助大家在考试中取得好成绩,下面就是坦途网为大家收集整理的2018年12月8日雅思写作预测题汇总,供大家参考。
>>雅思考试预测题:2018年12月8日雅思写作机经预测1
线图
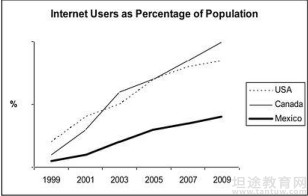
网络人口
The graph below shows the proportion of the population aged 65 and over between 1940
and 2040 in three different countries.

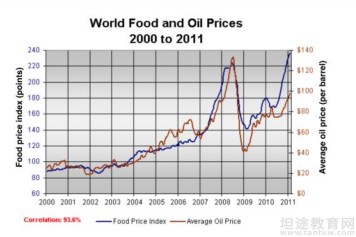
线图:价格变动
The graph below shows changes in global food and oil prices between 2000 and 2011.

饼图
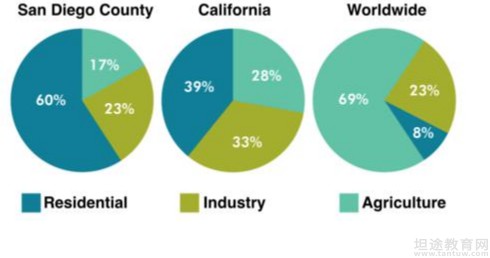
饼图:三地用水
The pie charts below compare water usage in San Diego, California and the rest of the world.

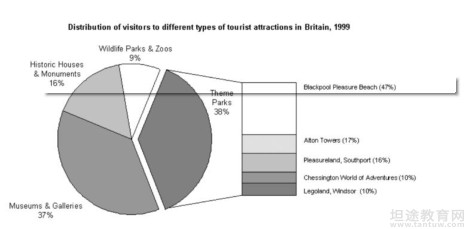
饼图:游客分析
The chart below shows the results of a survey of people who visited four types of tourist
attraction in Britain in the year 1999.

以上就是小编为各位考生准备的有关雅思的大小作文写作预测题,有需要的小伙伴们可以自行提取。大家在备考的路上很艰辛,不过还是要坚持下去,小编相信最后一定会有让你满意的雅思考试成绩。还想了解更多考试资讯,就来坦途网雅思考试频道找我吧!
温馨提示:因考试政策、内容不断变化与调整,坦途网提供的以上信息仅供参考,如有异议,请考生以权威部门公布的内容为准!
雅思培训课程免费试听
