2018年雅思写作素材及内容解析4
>>雅思写作考试:2018年雅思写作素材及内容解析4
TASK 1
类型:饼状图
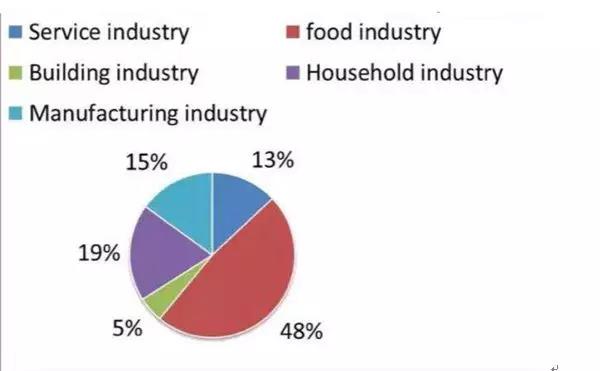
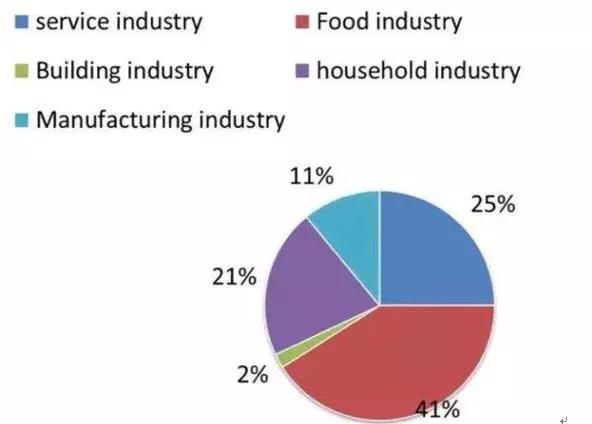
题目:The charts show the total water use in different sectors in Sydney, Australia in 1997 and 2007.


字数:150 words
The two pie charts illustrate the percentage of total water use in five different industry sectors including service, food, building, household and manufacturing in Sydney, Australia in two separate years: 1997 and 2007.
Generally speaking, the water use in food industry constituted the largest part in both years and decreased slightly from 48% to 41%; while building industry consumed the smallest proportion, declining from 5% in 1997 to only 2% in 2007.
It should also be noticed that the proportion of water use in service industry showed a dramatic increasing trend, nearly doubled from only 13% in 1997 to 25% in 2007. By contrast, the percentage of water use in household industry and manufacturing industry both fluctuated slightly, ranging from 19% to 21% and 11% to 15% respectively.
Overall, the percentage of water consumption remained relatively stable in food, manufacturing and household industry while fluctuated obviously in building and service
以上就是小编精心为您准备的雅思写作回顾素材及解析啦,相信您看了以后会对自己的雅思考试更有信心了,也预祝您在8月2日的雅思考试中取得一个好成绩。您还可以登录坦途网雅思考试频道,更多题型回顾等您领取!
温馨提示:因考试政策、内容不断变化与调整,坦途网提供的以上信息仅供参考,如有异议,请考生以权威部门公布的内容为准!
- 2019年雅思考试经典写作必读满分范文508-23
- 2019年雅思考试经典写作必读满分范文408-23
- 2019年雅思考试经典写作必读满分范文308-23
- 2019年雅思考试经典写作必读满分范文208-23
