2018雅思写作小作文范文:食物石油价格
>>雅思写作范文赏析:2018雅思写作小作文范文:食物石油价格
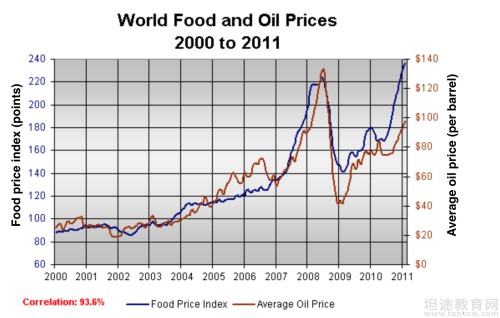
The graph below shows changes in global food and oil prices between 2000 and 2011.
该线图展示2000-2011年间全球食物和石油价格变化情况。请作答。

雅思图表小作文线图9分范文:
The line graph compares the average price of a barrel of oil with the food price index over a period of 11 years.
It is clear that average global prices of both oil and food rose considerably between 2000 and 2011. Furthermore, the trends for both commodities were very similar, and so a strong correlation (93.6%) is suggested.
In the year 2000, the average global oil price was close to $25 per barrel, and the food price index stood at just under 90 points. Over the following four years both prices remained relatively stable, before rising steadily between 2004 and 2007. By 2007, the average oil price had more than doubled, to nearly $60 per barrel, and food prices had risen by around 50 points.
A dramatic increase in both commodity prices was seen from 2007 to 2008, with oil prices reaching a peak of approximately $130 per barrel and the food price index rising to 220 points. However, by the beginning of 2009 the price of oil had dropped by roughly $90, and the food price index was down by about 80 points. Finally, in 2011, the average oil price rose once again, to nearly $100 per barrel, while the food price index reached its peak, at almost 240 points.(211)
上面的范文大家都看完了吧,是不是对你的写作很有帮助呢!如果想要了解更多雅思写作范文内容就登录坦途网雅思考试频道吧,小编在这里等你哦!
温馨提示:因考试政策、内容不断变化与调整,坦途网提供的以上信息仅供参考,如有异议,请考生以权威部门公布的内容为准!
