2018雅思写作范文:垃圾量的变化情况
>>雅思作文范文:2018雅思写作范文:垃圾量的变化情况
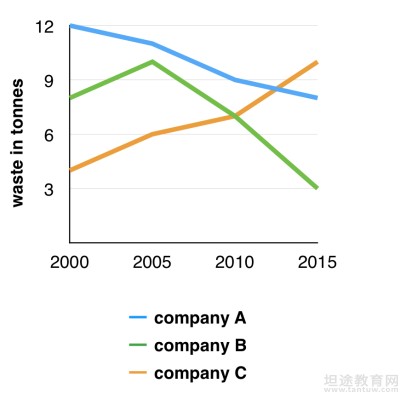
The graph below shows the amounts of waste produced by three companies over a period of 15 years.
该线图展示15年间3公司每年生产的垃圾量的变化情况。请作答。
雅思图表小作文线图9分范文:
The line graph compares three companies in terms of their waste output between the years 2000 and 2015.
It is clear that there were significant changes in the amounts of waste produced by all three companies shown on the graph. While companies A and B saw waste output fall over the 15-year period, the amount of waste produced by company C increased considerably.
In 2000, company A produced 12 tonnes of waste, while companies B and C produced around 8 tonnes and 4 tonnes of waste material respectively. Over the following 5 years, the waste output of companies B and C rose by around 2 tonnes, but the figure for company A fell by approximately 1 tonne.
From 2005 to 2015, company A cut waste production by roughly 3 tonnes, and company B reduced its waste by around 7 tonnes. By contrast, company C saw an increase in waste production of approximately 4 tonnes over the same 10-year period. By 2015, company C’s waste output had risen to 10 tonnes, while the respective amounts of waste from companies A and B had dropped to 8 tonnes and only 3 tonnes.(192 words, band 9)
上面的范文大家都看完了吧,看后要自己主动的去写多练习才能达到复习目的!了解更多雅思考试内容可以登录坦途网雅思考试频道,祝大家考试顺利。
温馨提示:因考试政策、内容不断变化与调整,坦途网提供的以上信息仅供参考,如有异议,请考生以权威部门公布的内容为准!
- 2019年雅思考试经典写作必读满分范文508-23
- 2019年雅思考试经典写作必读满分范文408-23
- 2019年雅思考试经典写作必读满分范文308-23
- 2019年雅思考试经典写作必读满分范文208-23