2018雅思写作范文:线图
>>雅思作文范文:2018雅思写作范文:线图
题目是:The graphs below show the performance of the trains in a train company in October and November in 2008.
作文范文
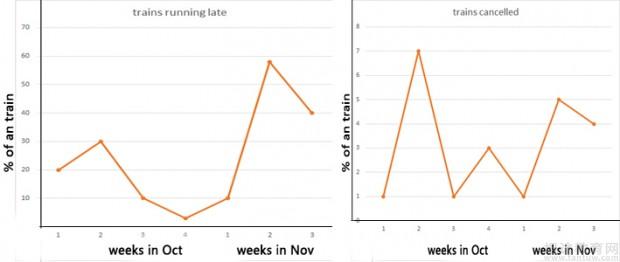
The two line charts compare the proportion of trains which were unpunctual and canceled in a particular train company in the whole October and the first three weeks of November in 2008.
As can be reflected from the first graph, starting from 20%, the number of late trains climbed to roughly one third before dropping considerably by the end of October when trains performed the best as merely 1% of them were late. Subsequently, the situation turned worse especially in the second week of November as more than half of the trains could not set out on time. After that, the figure declined, ending up with approximately 40%.
More significant variations could be spotted in the performance of canceled trains despite of a relatively lower percentage. At first, only 1% of trains were canceled, then the number soared to a peak at 7% in the following week followed by a plunge, dropping back to the same number of the first week. After some moderate ups and downs, trains canceled arrived at 4% in the end.
Overall, the problem of late trains was more serious in this train company and canceled trained had been controlled more effectively.
上面的雅思写作范文写得好不好?别看过就算了要记在自己的脑子里哦!想了解更多考试相关可以登录坦途网雅思考试频道,提前祝同学们都能取得理想的成绩啦!
温馨提示:因考试政策、内容不断变化与调整,坦途网提供的以上信息仅供参考,如有异议,请考生以权威部门公布的内容为准!
- 2019年雅思考试经典写作必读满分范文508-23
- 2019年雅思考试经典写作必读满分范文408-23
- 2019年雅思考试经典写作必读满分范文308-23
- 2019年雅思考试经典写作必读满分范文208-23