雅思考官推荐:雅思柱状图小作文学习六
>>雅思写作:雅思考官推荐:雅思柱状图小作文学习六
柱状图:各地房价
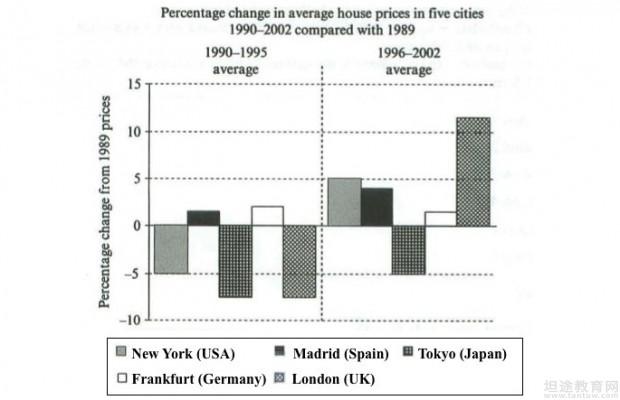
The chart below shows information about changes in average house prices in five different cities between 1990 and 2002 compared with the average house prices in 1989.下面的图表显示了与1989年的平均房价相比,1990年至2002年间五个不同城市的平均房价变化情况。

范文如下:
The bar chart compares the cost of an average house in five major cities over a period of 13 years from 1989.
We can see that house prices fell overall between 1990 and 1995, but most of the cities saw rising prices between 1996 and 2002. London experienced by far the greatest changes in house prices over the 13-year period.
Over the 5 years after 1989, the cost of average homes in Tokyo and London dropped by around 7%, while New York house prices went down by 5%. By contrast, prices rose by approximately 2% in both Madrid and Frankfurt.
Between 1996 and 2002, London house prices jumped to around 12% above the 1989 average. Homebuyers in New York also had to pay significantly more, with prices rising to 5% above the 1989 average, but homes in Tokyo remained cheaper than they were in 1989. The cost of an average home in Madrid rose by a further 2%, while prices in Frankfurt remained stable.
本文为雅思考官推荐,帮助大家充分备考雅思写作。接下来,坦途网雅思考试频道将会为大家带来更多雅思写作优秀范文,敬请关注!
温馨提示:因考试政策、内容不断变化与调整,坦途网提供的以上信息仅供参考,如有异议,请考生以权威部门公布的内容为准!
